Why STEMI vs NSTEMI Isn’t Always the Whole Story
When it comes to diagnosing acute myocardial infarction (MI) on the ECG, most textbooks drill in the STEMI vs NSTEMI divide. On paper, it’s simple: ST Elevation Myocardial Infarction (STEMI) shows clear ST elevations, while Non-ST Elevation MI (NSTEMI) does not. But in real life, the heart—and its electrical signals—rarely fit so neatly into boxes. Let’s crack open what textbooks get right, where they fall short, and why cardiac biomarkers like troponin are often the real game-changer in acute MI diagnosis.
What Textbooks Get Right—and Where They Absolutely Don’t
Textbooks are correct that STEMI vs NSTEMI is a clinically important distinction. STEMI usually means a full-thickness injury to the heart muscle, often from a complete blockage of a coronary artery. NSTEMI, on the other hand, is usually a partial blockage or a supply-demand mismatch, and may show ST depression or T wave inversion on ECG. But here’s the catch: NSTEMI diagnosis requires cardiac biomarkers—specifically, troponin elevation. Without elevated troponin, you’re dealing with unstable angina, not NSTEMI.
But the ECG can be a trickster. NSTEMI may show subtle changes (or none at all), and STEMI can sometimes be missed if the infarct is in a “silent” territory or if the patient presents late. Plus, both STEMIs and NSTEMIs alike may or may not result in Q waves. The presence or absence of Q waves does not always tell the whole story about the age or severity of the infarct.
Personal Anecdote: The Case That Made Me Trash the ‘Q Wave Means Old MI’ Myth
I’ll never forget the patient who changed my thinking. Middle-aged, classic risk factors, chest pain for just a few hours. His ECG showed deep Q waves in the inferior leads—textbook would have called this an “old MI.” But his troponin was sky-high, and his pain was new. Angiography confirmed an acute occlusion of the right coronary artery. That day, I learned: Q waves can develop within hours of an acute MI, and their presence doesn’t always mean the event is ancient history. As the saying goes, “Both STEMIs and NSTEMIs alike may or may not result in Q waves.”
All the Ways Acute Coronary Syndrome Outsmarts Tidy Categories
- Q wave MI vs Non-Q wave MI: These terms are mostly obsolete, but you’ll still hear them. They refer to whether the MI results in pathologic Q waves. But Q waves can appear in both STEMI and NSTEMI, and sometimes not at all.
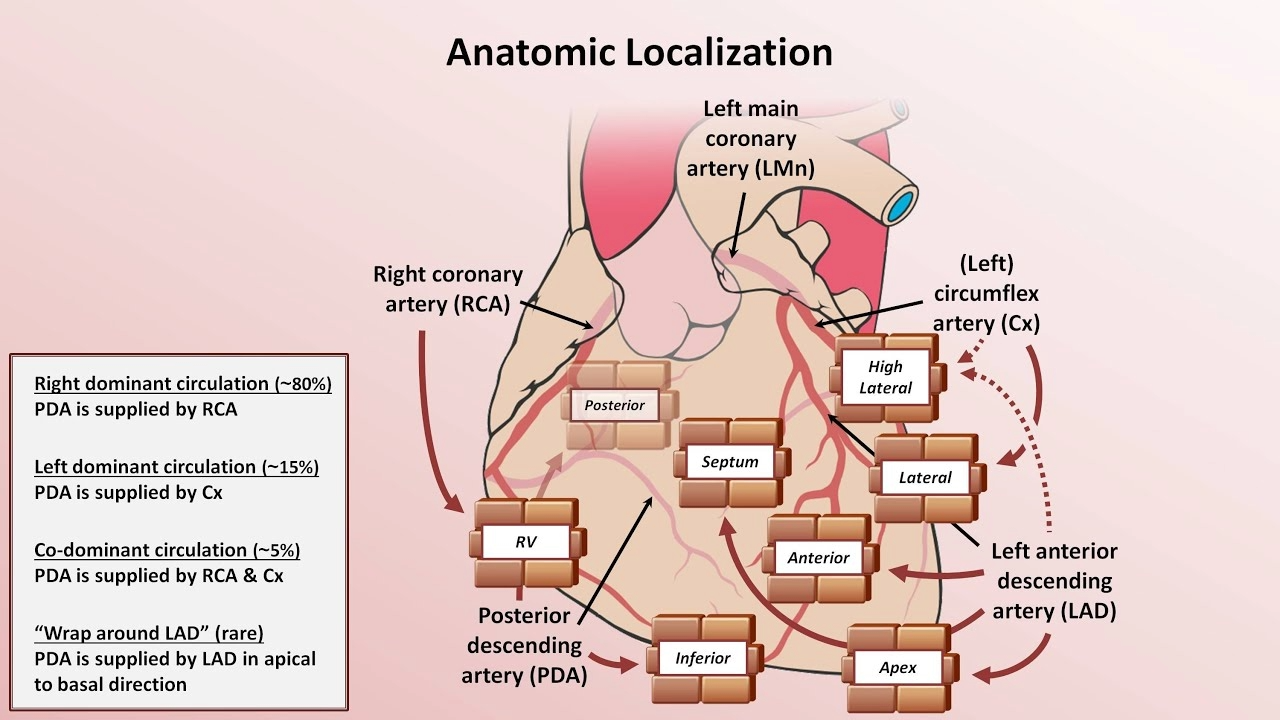
- Localization: ECG changes can hint at which wall or artery is involved, but the heart’s blood supply is variable. For example, about 80% of inferior/posterior walls are supplied by the RCA, but 15% are left-dominant, and 5% have rare variants.
- Biomarkers trump ECG: Troponin elevation is what separates NSTEMI from unstable angina, not the ECG pattern. Sometimes, the ECG is completely normal, but the troponin tells the real story.
- Other ECG findings: Pathologic Q waves, new QRS axis deviation, poor R wave progression, and new conduction blocks (like AV block or bundle branch) can all signal MI, but none are exclusive to STEMI or NSTEMI.
So, while STEMI vs NSTEMI is a helpful starting point, acute coronary syndrome is a master of disguise. The ECG is just one piece of the puzzle—cardiac biomarkers like troponin, clinical presentation, and sometimes even a bit of detective work are all essential for cracking the code.
ECG Evolution After MI: Expect the Unexpected
One of the most fascinating—and honestly, frustrating—aspects of reading ECGs after a myocardial infarction (MI) is how the findings evolve over time. The classic teaching is a neat progression: hyperacute T waves, then ST segment changes, then Q waves and T wave inversions. But in real life, the timeline is rarely so tidy. Let’s break down the actual ECG Evolution After MI, and why you might miss key findings even when you’re looking for them.
The Timeline: From Hyperacute T Waves to Q Waves
- Hyperacute T Waves: The very first change that can occur is increased prominence of T waves, often referred to as hyperacute T waves. These are tall, broad, and symmetrical T waves that pop up within minutes of coronary occlusion. They’re the earliest ECG sign of acute MI, but here’s the catch—they vanish quickly, often before the patient even reaches the hospital. I’ve waited for ST elevation, only to realize later that the hyperacute T waves were already gone. No wonder they’re so rarely seen in clinical practice.
- ST Segment Changes: Usually within an hour, the ST segments become abnormal. This can mean ST elevation (the classic sign of transmural injury) or ST depression (often seen in reciprocal leads or subendocardial ischemia). ST elevations can last for a couple of days, sometimes even up to a week. ST depressions, on the other hand, may persist much longer—occasionally indefinitely.
- T Wave Inversions: Within the first several hours, T waves often flip and become inverted. These inverted T waves can stick around for weeks, months, or even permanently. They’re a sign of evolving ischemia and reperfusion, but they don’t tell you exactly when the MI happened.
- Pathological Q Waves: The final new change is the development of Q waves, which typically appear hours to days after the infarct. Q waves are usually considered permanent markers of myocardial necrosis, but even these can sometimes fade over years. It’s rare, but it happens.
Why Some ECG Findings Are Easy to Miss
In theory, the sequence of ECG Findings in MI is straightforward. In practice, it’s easy to miss the fleeting early changes. Hyperacute T waves, for example, are so transient that by the time most patients get an ECG, they’ve already disappeared. I’ve learned the hard way that waiting for ST elevation can mean missing the earliest clues. ST elevations themselves can linger, making it hard to tell if you’re looking at a fresh MI or one that’s a few days old.
Pitfalls of Dating Infarcts on ECG Alone
After the acute phase, the ECG becomes a less reliable historian. Once ST elevations have resolved and cardiac biomarkers have returned to baseline, it’s tough to pinpoint the age of the infarct just by looking at the tracing. Pathological Q waves are usually a sign of an old MI, but since they can sometimes disappear, even that isn’t foolproof. There are times when an ‘old’ MI looks just like a subacute one, and the ECG alone can’t tell you the difference.
“The very first change that can occur is increased prominence of T waves, often referred to as hyperacute T waves.”
Understanding the ECG Evolution After MI means expecting the unexpected. The classic sequence is a helpful guide, but real-world ECGs don’t always follow the textbook. Stay alert for the subtle, fleeting changes—and remember, sometimes the clues you need are already gone.
Real-World Lead Groupings: Or, Why EKGs Don’t Care About Your Mnemonics
When it comes to 12-lead ECG interpretation and anatomical localization of myocardial infarction (MI), the classic lead groupings you learned—those neat boxes and mnemonics—are more of a starting point than a rulebook. The heart’s anatomy, and the way infarctions present on the ECG, rarely fit into these tidy categories. In real life, there’s overlap, ambiguity, and sometimes, total chaos.
Lead Complexes Localization: The Textbook Version
Most of us start with the “standard” groupings:
- Inferior leads: II, III, aVF
- Septal leads: V1, V2
- Anterior leads: V3, V4
- Lateral leads: I, aVL, V5, V6
These groupings are helpful for basic anatomical localization of MI. For example, ST elevation in anterior leads V1-V4 suggests an anterior MI, often due to occlusion of the left anterior descending artery (LAD).
Why Real-World ECGs Break the Rules
Here’s the catch: anatomy rarely respects our neat divisions. As I often remind myself, “For the specific task of EKG interpretation I separate the ventricular myocardium into eight regions supplied by three major coronary arteries.” But even this is a simplification.
- Overlap is common. The septal and anterior leads (V1-V4) often blend together. A true “anterior” MI may spill over into lateral or even inferior territories, depending on the patient’s unique anatomy.
- LAD territory is variable. The LAD doesn’t just supply the anterior wall—it can also feed the septal and high lateral walls. So, an LAD occlusion might show changes in V1-V4, but also in I, aVL, V5, and V6.
- Leads V1 and V2 are wild cards. These can pick up septal, anterior, posterior, and even right ventricular changes. For example, a posterior MI may show as ST depression in V1-V2, which can be mistaken for “septal” ischemia if you’re not careful.
Wild Card: When a Big MI Breaks Every Rule
Sometimes, a large infarct just wipes the slate clean. You might see ST elevation across multiple territories, or reciprocal changes that don’t fit the classic patterns. In these cases, rigidly memorized mnemonics fall short. You need to think anatomically and consider the possibility of a “wraparound” LAD or a dominant right coronary artery supplying unexpected regions.
For the specific task of EKG interpretation I separate the ventricular myocardium into eight regions supplied by three major coronary arteries.
Key Takeaways for 12-Lead ECG Interpretation
- Anatomy rarely respects the ‘standard’ lead groupings. Expect overlap—even in classic MIs.
- Lead V1 through V4: more complicated than just ‘anterior.’
- Sometimes a large MI blanks out every rule you thought you knew.
In summary, lead complexes localization on the ECG is a powerful tool, but it’s not absolute. The heart’s anatomy and the variability of coronary supply mean that real-world patterns often blur the lines between “septal,” “anterior,” and “lateral” infarcts. Stay flexible, and always interpret the 12-lead ECG in the context of the patient’s clinical picture and possible anatomical variations.
Reciprocal Changes and the Joys of Confusion
If you’ve ever stared at an ECG and felt like the rules you’d just learned were being rewritten before your eyes, you’re not alone. Reciprocal changes—especially reciprocal ST depression—are the ultimate curveball in reading myocardial infarction on ECG. No one ever mentions how reciprocal changes seem to break all the logic you thought you’d mastered. Just when you think you’ve got the geography of the heart mapped out, the ECG throws you a surprise.
Let’s start with what reciprocal changes actually are. These are ST segment changes, usually depressions, that show up in ECG leads opposite to the area of the heart experiencing acute injury. In theory, it sounds straightforward: if there’s ST elevation in one area, look for ST depression on the other side. But here’s the twist—the heart isn’t a neat, symmetrical box. It’s an irregularly shaped structure, and the leads don’t always pair up in ways that make intuitive sense. As one of my mentors once said,
“The anterior and inferior walls certainly don’t seem like they should be on opposite sides of the heart but on the EKG they can act as if they are.”
Take the classic example: an inferior STEMI. You’d expect changes in the inferior leads (II, III, aVF), but then—almost magically—you see reciprocal ST depression in the anterior leads (like V1-V4). It’s mind-bending! And it works the other way, too: an anterior STEMI can show reciprocal changes in the inferior leads. The geography on the heart rarely lines up as expected, and this is where the joys—and frustrations—of reciprocal changes really come into play.
I remember a patient who came in with crushing chest pain. The ECG looked almost normal at first glance, but there was subtle ST depression in the anterior leads. It was only after piecing together the clinical story and looking for reciprocal changes that the diagnosis of an inferior MI became clear. That’s the thing about reciprocal ST depression: it’s a powerful sign of acute MI, but its absence doesn’t rule out the diagnosis. Sometimes, the ECG is misleadingly “normal,” except for those classic reciprocal changes that give the real story away.
Reciprocal changes are both a diagnostic boon and a conundrum. They can support your suspicion of STEMI, but they can also confound your expectations. The key is to always fit the ECG to the clinical story—never trust patterns alone. The presence of reciprocal ST depression in leads opposite the infarcted area can be a strong clue, but don’t let its absence lull you into a false sense of security.
In the end, cracking the code of myocardial infarction on ECG means embracing a bit of confusion. The heart doesn’t always play by the rules, and neither do its electrical patterns. But with a careful eye for reciprocal changes and a healthy respect for the unpredictable, you can turn even the most mind-bending ECG into a tool for better patient care.